Some of the most pressing challenges, trends, and innovations for applying data and statistics to the 2030 Agenda for Sustainable Development were discussed at the first UN World Data Forum held in Cape Town, South Africa from January 15-18, 2017. The forum brought together a compelling cross-section of national statistics, government, private sector, and civil society stakeholders - an approach uncommon to traditional UN gatherings. By bringing data communities together to include topics such as big data, geospatial and earth observation data, citizen-generated-data, and open data as part of the broader national statistics dialogue, the range of participants and corresponding talks was astounding.
It was within this unique context that we wanted to put together a session on data visualizations to support the 2030 Agenda with a focus on moving the discussion from data for reporting and monitoring to data for action and decision making. An expert panel was assembled consisting of non-profit, private sector, and development bank representatives: Fanie le Roux (Moyo Business Advisory, Tableau Partner), Rafik Mohjoubi (African Development Bank), Craig Mills (Vizzuality), Alexandra Silfverstolpe (Data Act Lab), Charles Brigham and Richard Kaufholz (Esri), and Rebecca Firth (Humanitarian Open Streetmap).
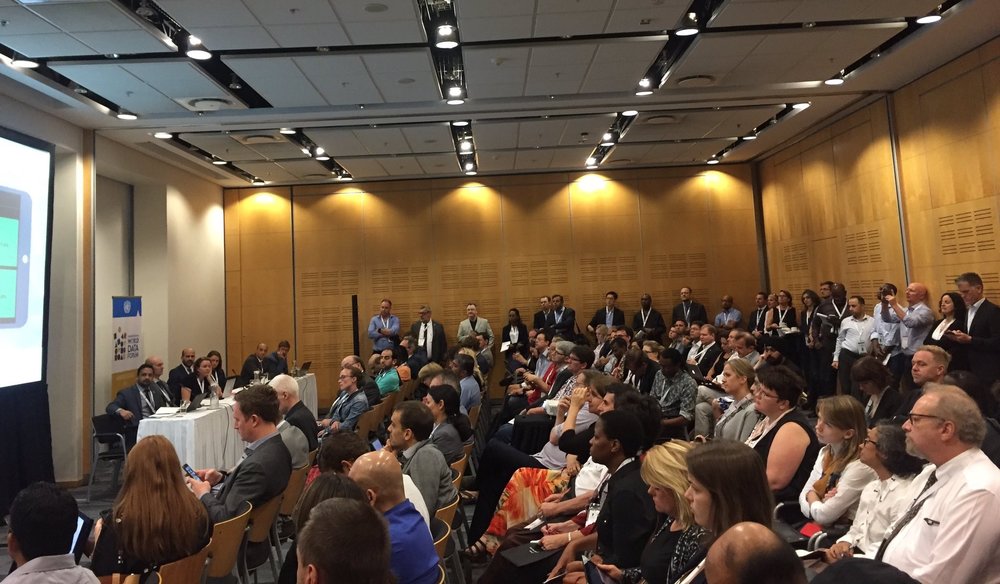
We were not quite sure what the turnout for this session would be given the topic at a conference focused more on national statistics. However, we were quite pleased with the results – standing room only! The outcome likely speaks to the broader interest and appetite for really understanding how insights from data are surfaced and communicated to better inform action, decision making, and policy in a world where platforms and dashboards are increasingly available.
Each of the panelists provided a unique perspective on how data visualizations and dashboards can be used to drive impact, decisions, and action with some key messages and common threads:
- Using and developing a data ecosystem approach further enables data sharing across sectors and users, while also providing the capability to make visualizations more accessible.
- Platforms can further enable the coordination of efforts and ease friction on data access and sharing.
- The use of technology and platforms needs to be country owned and led and not one size fits all.
- Access to data by itself is not enough – there is a need to consistently evaluate how it is being applied and used.
- Technology is evolving rapidly, therefore we need to keep up and be adaptive.
- The use of crowd/citizen-generated can provide huge advantages for filling data gaps in fairly short order.
There is much work to be done and countries are at their initial stages of defining a path forward for achieving the SDGs. Within the context of the data revolution where data is becoming more accessible, timely, and cost-effective, bringing these data together (official and non-official) offers a great opportunity to meet the demands of the broader SDG framework. Data visualization offers one way to drive impact through the effective communication of stories inherent in the data to a broad range of stakeholders such that the information can be more easily consumed and understood.
Based on the outcomes of this session, and the collective expertise of the group, a data visualization module will be developed for the Data4SDGS Toolbox. Stay tuned as further information becomes available.