
The General Directorate of Statistics, Survey, and Census (DGEEC) is responsible for generating statistics (National and Economic Census, Household Surveys, Surveys of Trades and Services, Tourism, Victimization, etc.) that provide visibility on the situation of the territories, the needs of the communities, and changing trends among the Paraguayan people, as well as providing data that allows for evidence-based decision-making to develop robust public policies that respond to both behavioral and structural challenges.
Throughout the years, as the institution responsible for the national statistical production, the DGEEC has focused on statistics becoming a bridge between the public sector and society. This means seeking to reach every citizen in a way that not only serves practitioners and experts, but also the common user (professionals from all fields, students, authorities, etc.) to have a sense of belonging and to understand and use statistical data in a comprehensive manner as part of their daily activities.
Statistical data are used to study situations, events, and phenomena of both the past and the present. Using this information, the country can deploy preventative measures; this is done by aligning multi-sectoral strategies for decision-making at all levels that affect people's living conditions. Community involvement and public engagement, therefore, play a crucial role in oversight, dissemination, and research. Both researchers and students from different educational levels have more comprehensive, updated, and dynamic access to the statistical information provided. Among the universities that stand out for their use of statistical information are Universidad Católica, Universidad Columbia del Paraguay, Universidad del Norte, Universidad Tecnológica Intercontinental, and Universidad Americana de Paraguay whose students have not only made inquiries about the availability of data access and image downloads but have also provided us with valuable feedback to continue improving our work.
Public engagement via visualizing data
During the COVID-19 pandemic, statistical data, especially demographic data, have become more relevant for the timely visibility of the spread of the virus in the territories, in order to focus resources on the most vulnerable populations in the country and to make decisions in real-time. The use of digital mapping to overlay the layers of other indicators on health has been key. The pandemic has emphasized the critical role that information plays, not only during the crisis but at all times. In response, the DGEEC has worked on disseminating statistics through different means such as its website, where publications, reports, brochures, graphs, and Excel files are available, as well as microdata and data in an open format (Json, CSV).
The DGEEC has set out to strengthen the country's data culture by presenting statistics in a visual, dynamic manner that is easily understood by all. As of 2019, the institution has recreated the results of different statistical operations through interactive visualizations made in Tableau1, thanks to the Tableau Foundation and Cepei alliance made possible by the efforts of the Global Partnership for Sustainable Development (the Global Partnership).
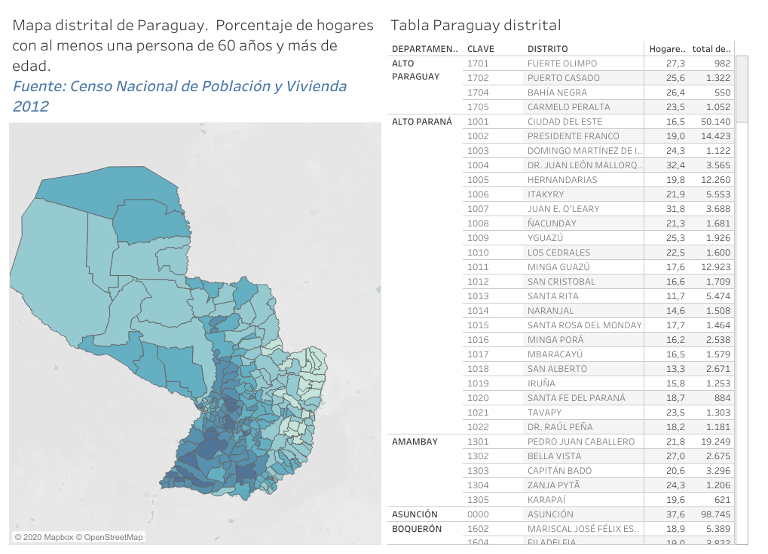
Data visualizations allow users not only to present information but also to tell stories through the dynamic exploration of graphs, tables, maps, timelines, among others, making use of filters and comparisons. Visualizations also eliminate data noise and highlight important information. Therefore, it is possible to identify quantitative, qualitative, and geographic data at a high level of detail, as well as trends with a simple view, superimposing several layers of data. This, among many more possibilities, would be much more difficult to achieve through static visualizations.
In May 2019, Paraguay joined the Global Partnership. Since then, the DGEEC has been a strategic partner to strengthen the data ecosystem in the country, working hand in hand with Cepei—the Global Partnership's Technical Secretariat for Latin America and the Caribbean—on different projects, including strengthening the technical and design capacities to present statistics in more user-friendly and interactive ways. To this end, in addition to granting the Tableau license, Cepei has supported the visualization processes through consultancy.
The DGEEC has a specific section of visualizations on its institutional website, where data from the three main statistical production areas of the DGEEC are published: National Census of Population and Housing (Census Bureau), National Economic Census (Economic Statistics Bureau), and Permanent Household Survey (Household Survey Bureau) in dashboard format produced in Tableau.
Visualizing social challenges
The visualizations correspond to data on poverty, populations with unmet basic needs, seniors, indigenous population, among others. These data have been used to identify vulnerable areas during COVID-19 and to visualize regions with poverty and extreme poverty through the heat maps offered by the tool. Among the departments that use this data is the Treasury Department, which uses it to support the social programs Pytyvõ (subsidy to informal workers) and Nangareko (subsidy for food aid for families).
This reflects how statistics and their georeferenced visualization have become tools for both resource allocation and policymaking in response and recovery. Also, the Director-General and the team at the Statistical Planning and Coordination Division participated in seminars such as #CovidDataChat, an initiative of the United Nations Statistics Division, Open Data Watch, and the Global Partnership on the impact of COVID-19, among other seminars on the operation of national statistical systems and the country's need for timely data visualization.
The use of Tableau has been a very enriching learning process, with some challenges such as transforming the base data into and charts. The process of refining the data is a time-consuming and meticulous task. However, once the data has been adjusted and loaded into Tableau, experimenting with different visualizations allows us to identify the best graphs, styles, and complements that convey the statistical data in a timely manner.
The DGEEC will continue working to refine the visualizations of the various operations by including new elements to the presentation of statistics, especially for the National Population and Housing Census 2022 that will begin in 2021 with the pre-census stage, as well as for thematic surveys.
1. A visual analysis platform that transforms the way in which we use data to solve problems (Tableau).