
In 2021, the Global Partnership, through its joint program, Data for Now: Building Africa’s Resilience to Covid-19, with the United Nations Economic Commission for Africa (UN ECA), collaborated with NVIDIA, and its technology partners via the United AI Alliance Initiative, with Future Tech providing a major investment of devices from Dell Technologies. This collaboration aimed to strengthen data science infrastructure and skill capacity for several National Statistical Offices (NSOs) in Africa and Latin America.
The project provided essential technology infrastructure to enhance data science capacity and digital transformation, improving data management and use, national statistical system strengthening, and resilience building for future national responses. Ghana Statistical Service (GSS) was one of the ten (10) partner institutions that participated in this initiative. To customize the intervention for each country, the initiative conducted in-depth consultations and needs assessments to identify gaps in data science infrastructure, skills, and capabilities. This investment further supported the already established Data Science Unit of GSS in utilizing advanced data science methods to automate statistical production and produce more timely and granular statistics, informing evidence-based policymaking in Ghana.
The problem
The challenges identified by GSS included:
- Inadequate IT infrastructure and storage capacity to handle terabytes of census data from agricultural and industrial censuses
- Insufficient computing power, compounded with technical challenges in expanding computer memory and upgrading systems to efficiently process and manage vast datasets
- Inefficient workflows due to reliance on Virtual Private Networks (VPNs) for secure data storage and access
- Difficulties in automating data processing tasks and upgrading systems to meet data requirements
- Skill gaps in data presentation, advanced analytics, and implementing data science concepts.
The impact of these issues extended beyond the data science team. These issues not only affected GSS but The Ghana Statistical Service as a whole, including along with other government agencies, researchers, and policymakers who rely on accurate and timely census data, were all affected by the difficulties in managing and processing the information efficiently.
To meet the outlined demands, GSS was already in the process of establishing a robust data science department. However, challenges remained such as setting up a new unit without an existing administrative structure and transitioning its statistical team into a data science-driven environment, able to deploy hardcore programming, data science and other computing skills. The data science team also struggled to process, store, and manage vast datasets efficiently.
Kwamena Leo Arkafra, GSS's Data Science Lead, highlighted that at the heart of the problem was insufficient computing power and memory to handle large datasets. The team found themselves relying on Virtual Private Networks (VPNs) to securely store and access data remotely, a cumbersome and time-consuming process. Automating data processing tasks proved to be another hurdle, leading to inefficient workflows and increased workload for the team. Even expanding computer memory and upgrading systems to meet data processing requirements posed technical challenges.
The approach
The Data Science Capacity Strengthening Initiative aims to enhance NSO’s data science capabilities by providing AI-enabled hardware and software, initial data science training, and ecosystem support. As Mr. Arkafra noted, “Overcoming this skills gap has required intensive on-the-job training and a shift in mindset. Further capacity building efforts with other partners in our network, like the UK Office for National Statistics and Statistics Denmark, have also contributed to enhancing the skills of GSS data scientists in R, Python, machine learning, and other key areas.’’
Outcomes and results
With enhanced data science capabilities, GSS is driving improved products and processes in various use cases related to census data, including:
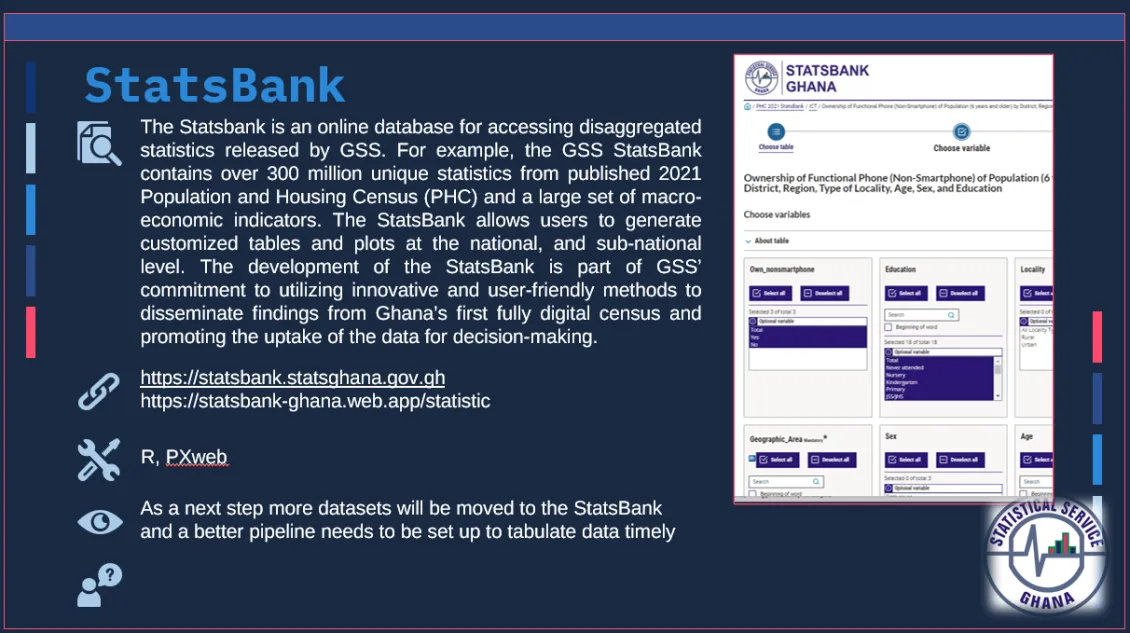
- Developing a StatsBank that allows users to easily access, filter, and download key indicators, significantly simplifying data discovery and utilization.
- Utilizing advanced workstations to process and analyze census data, which then feeds into the StatsBank and other analytical products.
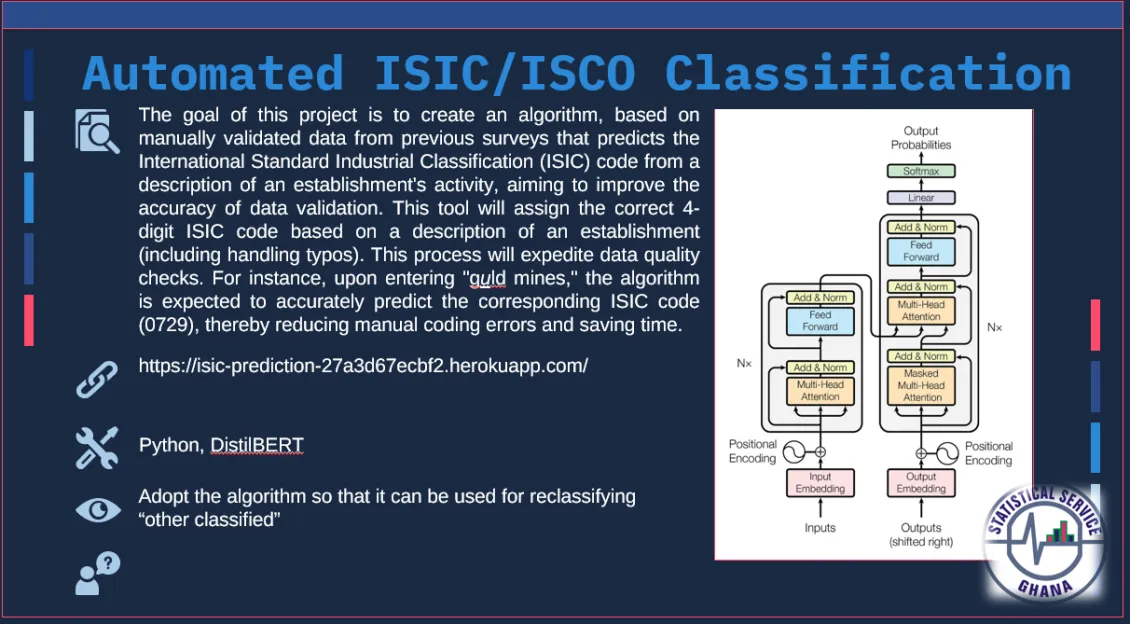
- Training machine learning models to automatically code industry classifications from economic census data.
- Establishing a Gridded Data Platform for disseminating Census Statistics at a hyper-localized level.
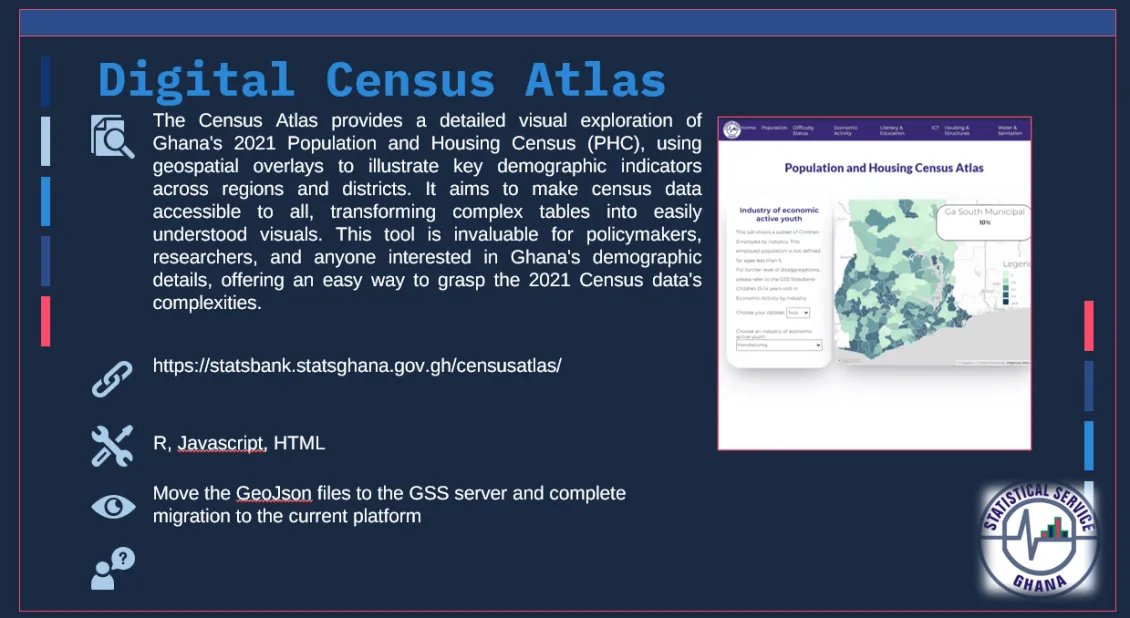
- Designing a Digital Census Atlas to provide visual exploration of the 2021 Population and Housing Census data using geospatial overlays.
- Implementing an automated ISIC/ISCO classification algorithm to predict industry and occupation codes from text descriptions.
- Analyzing Automatic Identification System (AIS) data from vessels to develop proxy indicators for trade statistics, and more.
Challenges and lessons
Through their data science initiatives, GSS has not only improved its census data processing but also applied advanced techniques to automate and enhance statistical production across various domains. For example, the organization has used machine learning to automate the coding of industrial classifications and occupations, saving significant time and effort compared to manual methods. In the education sector, GSS data scientists have scraped 10 years’ worth of statistics from PDF reports into a structured database, making this valuable data more accessible and analyzable. In the transportation domain, GSS has produced reports on port activity using automated information system (AIS) shipping data, providing new insights into maritime trade and logistics. It has also automated data collection from district offices and generated statistical reports, streamlining the process of compiling subnational data.
However, this journey has not been without challenges, leading to valuable lessons:
Data quality and consistency:
When the Data Science unit set out to automate data collection and report generation from district-level administrative data, the team initially encountered issues with data quality and standardization. This experience highlighted the need to engage in advocacy with the districts to address these issues. As Mr. Arkafra noted, "We are now proactively engaging the appropriate administrative authorities to establish clear standards and guidelines so that in the future when we get more data, previous errors would have been fixed and corrected."
Real world problem-solving:
Mr. Arkafra noted the need to focus data science projects on practical manageable scope, and collaborate with stakeholders throughout the process. This approach ensured that data science solutions remained relevant and applicable to the NSO’s work.
Adapting to data realities:
When GSS worked on automating the coding of industrial and occupational classifications from census data, the team encountered variations, inconsistencies, and quality issues in the data. This was because certain assumptions and protocols initially used to develop the automated coding scripts did not fully account for the realities and variability of the data coming from the field. GSS had to continually adapt and refine their script, highlighting the importance of flexibility in such projects.
Validation processes:
To address unexpected data variations, GSS implemented collaborative validation processes. As Mr Arkafra explained, "We are using other means to validate and ensure that we don't report certain indicators that are not reflective of what is on the ground."
Next steps
The GSS journey with managing and processing large datasets underscores the urgent need for investment in modern data management systems, capacity building initiatives, and resource allocation to support the effective utilization of big data. Building on this progress, GSS aims to further enhance its data science team's skills, establish an enabling policy framework, and expand its IT infrastructure over the next one to two years. The agency's longer-term vision is to fully harness satellite imagery, mobile big data, and other frontier data sources to produce highly granular, timely statistics that can inform policy decisions across all sectors. GSS is poised to serve as a regional leader and knowledge partner for other African National Statistical Offices seeking to develop their own data science capabilities.
Use cases
Use Case 1: StatsBank, the #1 largest statistical repository in Ghana - Online Database for Accessing Disaggregated Statistics
An online platform allowing users to access and customize more than 300 million unique statistics from the 2021 Population and Housing Census and macro-economic indicators.
ProblemGSS faced challenges in making its vast statistical data accessible and relevant. Key issues included data accessibility, data granularity, time and resource intensity, limited data visualization, inconsistent data format, and limited data integration. This also hindered the timeliness, relevance and comprehensive analysis and insights of statistical data for evidence-based decision-making, policy formulation, research, and public information. | |
StakeholdersData providers: Ghana Statistical Service (GSS), other government agencies and ministries Platform management: GSS DSU, IT dept, subject matter specialists Data consumers: Government agencies, international organizations, private sector, media, civil society, general public, data professionals Data application: Policymakers, researchers, international organizations, private sector, media, civil society, general public, etc. | |
SolutionThe platform integrates more than 300 million unique statistics from the 2021 Population and Housing Census, 2017 Census of Agriculture, DHS, Annual Household Income and Expenditure Survey, and a large set of macro-economic indicators, making it accessible through a web interface. Users can generate customized tables and plots, access data at various levels, and use visualization tools for creating charts and graphs. The StatsBank is regularly updated with new data from GSS surveys and censuses, making official statistics more accessible to policymakers, researchers, students, and the general public. The platform's technology stack includes R and PXweb, ensuring robust data management and a user-friendly frontend. | |
Benefit/impact
| |
Use Case 2: Training machine learning models to automatically code industry classifications from economic census data (Automated ISIC/ICSO classification)
An algorithm that predicts the International Standard Industrial Classification (ISIC) code from a description of an establishment's activity, aiming to improve the accuracy of data validation.
| ProblemGSS was facing challenges in accurately and efficiently classifying industries and occupations according to international standards (ISIC/ISCO). Manual classification was time-consuming, prone to errors, and inconsistent across different surveys and censuses. This led to delays in data processing, reduced accuracy of economic statistics, and difficulties in international comparisons. |
| StakeholdersData provision: GSS surveys and census departments, other government agencies providing administrative data and Office of National Statistics, UK Platform management: GSS DSU, IT departments Data consumers: Government agencies, international organizations, researchers, private sector Data application: Policymakers, researchers, international organizations, private sector, media, civil society, general public, etc. |
| SolutionThe algorithm-based tool automates the classification of industries and occupations. The tool uses a machine learning model, natural language processing, predictive capability, error tolerance, and a user-friendly web interface. It can be integrated into existing data processing workflows and has real-world applications in survey and census processing, data quality improvement, real-time classification, administrative data processing, historical data reclassification, data cleaning, international comparability, labor market analysis, policy formulation, and private sector use. |
| Benefit/Impact
|
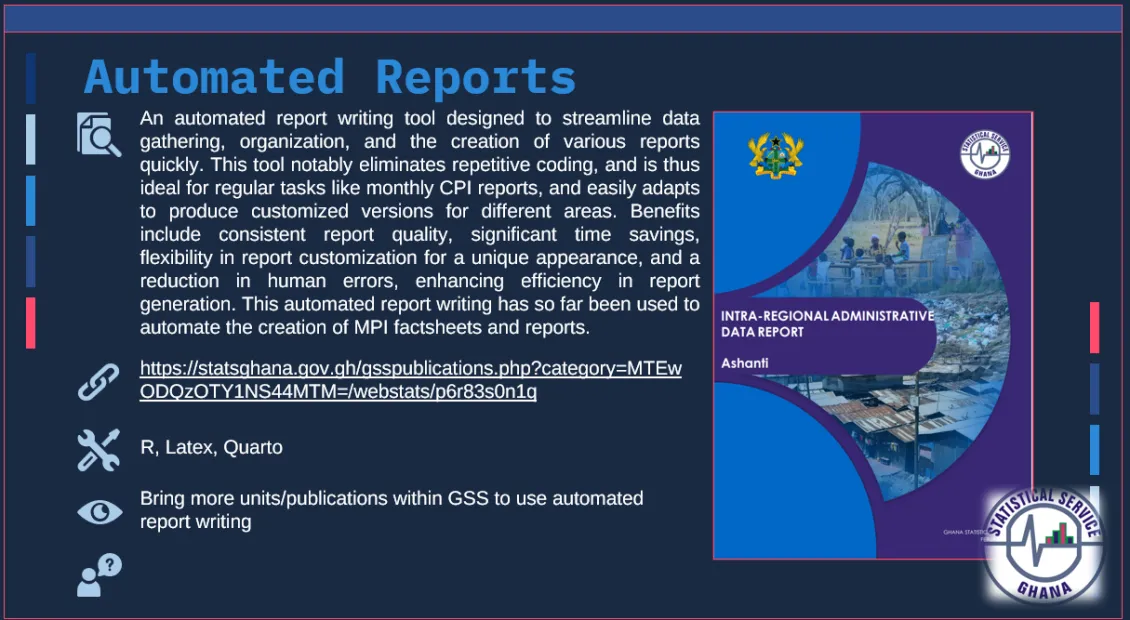
Use Case 3: Automating data collection from district offices and generating statistical reports (Automated reports)
A tool designed to streamline data gathering, organization, and creation of various reports quickly, eliminating repetitive coding.
| ProblemThe Ghana Statistical Service (GSS) is seeking a solution to streamline report generation, ensure uniformity in report quality, and free up staff resources for more complex analytical tasks, addressing inefficiencies and human errors in manual report writing. |
| StakeholdersData providers: Ghana Statistical Service (GSS), local government and other government agencies Platform management: GSS DSU, IT dept, subject matter specialists Data consumers: Government agencies, international organizations, private sector, media, civil society, general public, data professionals Data application: Policymakers, researchers, international organizations, private sector, media, civil society, general public, etc. |
| SolutionThe tool automates repetitive coding tasks, allows for customized reports, integrates with data sources, and report generation. It is used for regular economic reports, regional customization, multidimensional poverty index reporting, rapid response reporting, resource optimization, consistent data presentation, improved data accessibility, and quality control. The tool is enhancing the efficiency, consistency, and timeliness of statistical reporting in Ghana, supporting evidence-based decision-making across various sectors. |
| Benefit/Impact
|
Use case 4: Digital Census Atlas
A visual exploration tool for Ghana's 2021 Population and Housing Census (PHC), using geospatial overlays to illustrate key demographic indicators across regions and districts.
| ProblemThe Ghana Statistical Service (GSS) is working on making the 2021 Population and Housing Census data more accessible and understandable for stakeholders. Traditional methods were insufficient for conveying spatial patterns and trends, and GSS needed a visually appealing, interactive solution. |
| StakeholdersData providers: Ghana Statistical Service (GSS), local government and other government agencies Platform management: GSS DSU, IT dept, GIS specialists, subject matter specialists Data consumers: Government agencies, international organizations, private sector, media, civil society, general public, data professionals Data application: Policymakers, researchers, international organizations, private sector, media, civil society, general public, etc. |
| SolutionThe Ghana Statistical Service (GSS) has developed a Digital Census Atlas, an interactive web-based platform that provides a visual exploration of the 2021 Population Housing Census data. Key features include interactive maps, multi-layer visualization, customizable views, data export, and the ability to incorporate other relevant geospatial data sets. Real-world applications include: policy planning, resource allocation, education planning, health service delivery, urban planning, electoral planning, market research, social research, disaster preparedness, public awareness, infrastructure planning, agricultural planning, environmental management, and tourism development. |
| Benefit/Impact
|
Other projects include:
- Using drone imagery, machine learning, and computer vision to detect and classify the amount and types of litter on Ghanaian beaches.
- Exploring the use of Automatic Identification System (AIS) data from vessels as a possible proxy indicator for trade statistics.
- Finding secondary uses from the (meta)data that is collected as part of regular statistics production; for example, the analyses of prices data. The data science unit wrote code to clean and analyze raw prices data, allowing for a publication on the difference in prices of various food items in Ghana.
- Creating the Informal Cross Border Trade (ICBT) report to investigate whether communities situated near the border have any statistical advantages (for example, in terms of economic development) over those located further inland.
- Using geospatial technologies and satellite (remote sensing) data to measure progress towards various indicators for SDG 15: Life on Land, including the proportion of forest areas, mountain biodiversity, and freshwater biodiversity sites under protected status in the country.
- Creating survey monitoring dashboards to offer a near real-time overview of various projects and fields.

