
The Challenge
Mangroves are groups of trees and shrubs that live in coastal intertidal zones. Mangroves stabilize the coastline and provide a critical ecosystem for fish and other organisms, thus making them important lifelines for human and other species alike. But the mangroves in Sierra Leone are disappearing due to coastal erosion.
Human activities around the mangroves have led to landslides and the destruction of homes along the shoreline. As some of the land on the shoreline sinks, the tides rise and erode groves of trees, making it difficult for more trees to grow. In 2017, flooding in Freetown led to landslides, which destroyed homes and other property, and caused the deaths of around 1,000 people.
Sierra Leone must preserve its mangroves so the trees can continue to serve as protection from disasters and provide livelihoods to communities who live on the shorelines. Sierra Leone’s Environmental Protection Agency (EPA) is helping to save the mangrove ecosystem using Earth observation (EO) data. However, the EPA has been faced with the challenge of sourcing time series satellite data ranging from 2010 to present.
Response
The EPA knew it needed satellite data to see the big picture of what was happening with the mangroves, and how they have been changing over time. Satellite data is freely available, but it is very difficult to download, process, and analyze. This is what the Africa Regional Data Cube (ARDC) is for – it provides 17 years of Earth observation data and satellite imagery in an easily accessible, usable, and analysis-ready format. The ARDC’s time series satellite data enables policymakers to protect the shoreline, guiding the EPA’s interventions and decision-making that seeks to avert disasters such as flooding.
I participated in ARDC trainings in Nairobi, Kenya in May 2018, Freetown, Sierra Leone in April 2019, and Accra, Ghana in May 2019. Using the ARDC, I developed use cases on mapping mangroves in Sierra Leone, especially around Freetown and Yelibuya Island.
Using the Normalized Difference Vegetation Index (NDVI) thresholding and Normalized Difference Water Index (NDWI), the ARDC can identify mangroves and analyze how they change over time. The EPA used the ARDC to map mangroves around Freetown and Yelibuya Island from 2010 to 2016. The six-year period provided more information on the dynamics of mangroves in terms of gain and losses due to deforestation, as shown in the figures below. The color green shows areas with new mangroves, white shows areas with no change, and red shows areas with mangrove loss.
In Figure 1, the ARDC shows areas of forest loss around Freetown, and more specifically, in Hastings, Waterloo, and Aberdeen areas. This indicates areas prone to flooding and associated disasters.
In Figure 2, the ARDC shows areas of forest loss in the south of Yelibuya Island, Mahela, and Yeligban. This indicates areas prone to flooding and associated disasters.
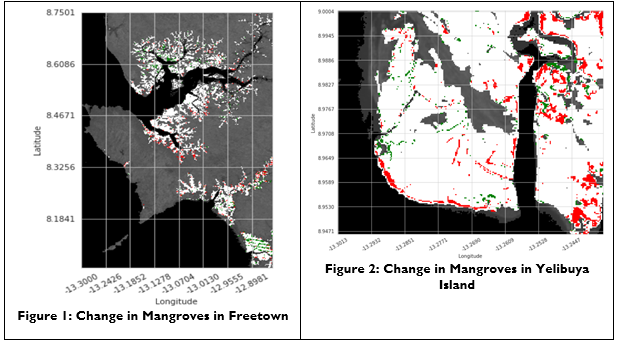
The mangrove changes in Freetown was observed as a loss of 2,209.86 hectares and a gain of 2,417.94 hectares, whereas Yelibuya Island showed a loss of 173.61 hectares and a gain of 58.59 hectares. Thus, Yelibuya Island experienced a high net loss in mangroves compared to Freetown. The results from the ARDC align with those from the Global Mangrove Watch (GMW), an initiative that tracks global mangrove extents.
Outcomes and Future Implications
The EPA is continuing to use the ARDC to learn more about the various scenarios associated with mangrove changes. This is helping the EPA draft an integrated coastal management policy, which will involve participatory mapping, a vulnerability assessment, and creation of incentives (free education, school feeding program, micro credit, renewable energy).
The EPA plans to update the various mangrove plans in line with the Sierra Leone National Development agenda as well as the Sustainable Development Goals (SDGs), especially SDG 14.5 on coastal mangroves. The EPA is also keen on maintaining sustainability of mangroves in Sierra Leone in line with the Ramsar Convention on Biological Diversity. For example, the EPA will propose mangrove conservation especially in Aberdeen creek – a Ramsar site – where it plans to produce a buffer zone (to protect mangroves).
These efforts aim to be designed in such a way, and with complementary programs that also seek to improve coastline biodiversity and poverty reduction in the country. For example, the EPA will propose alternative livelihoods to affected communities. This will involve providing microcredits and opportunities in alternative businesses.
Furthermore, the EPA recognizes the importance of knowledge-sharing and collaboration. As we continue to use and learn from the ARDC and other Earth observation sources in collaboration with the Global Partnership for Sustainable Development Data and others, we aim to raise awareness on how EO data can help protect and conserve mangroves in order to ensure sustainable development progress and sustain livelihoods.
