Illustration by Maryjane Uzodinma/Global Partnership for Sustainable Development Data.
What drew you to taking part in this fellowship program, and how have you found the experience?
I have a Masters in Mathematical Sciences from the Africa Institute for Mathematical Sciences (AIMS) in Senegal and have previously worked in similar roles, for example with the Rwanda Environment Management Authority, where I was involved in the use of satellite images for land use facilitation, and on collaborative research with Imperial College and other partners to digitally survey air quality across select African cities. I was drawn to this Fellowship because, like the experience I’ve mentioned, it is focused on development issues, and this was another opportunity for me to work on another project aligned with the SDGs.
Census data is a relatively new field to me, so I expected to be challenged. After doing research and clarifying objectives with the team, I have found the experience as enlightening and rewarding as it was challenging. After the virtual Data Science Fellowship onboarding workshop, where I was introduced to the GSS team, I was able to go to their Accra offices and meet David Bessah, my direct supervisor, and the eight members of the data science team involved in this project. Having done some research on the task at hand, I presented my proposed methodology and a demo of what I thought the dashboard in question might look like to the team. Based on their feedback, we were able to strategize together on the desired layout and functionality of the dashboard, as well as the way forward. Most importantly, I learned a lot about the census process.
What were the objectives of your fellowship?
Ghana has just carried out its latest population and housing census. For the first time, the census was conducted using a digital data capture and transfer system. This facilitated real-time data quality monitoring, reduced data processing time and integration of GPS-based information, which has added new spatial data layers and allows for spatial analysis of the population's access to basic services. In preparation for this, my goals were to (1) develop an interactive dashboard using a specific set of variables for demonstration purposes, and (2) train GSS data science staff on development of the dashboard. This will equip the GSS data science team to develop and deploy a Python program that will enable automated data analysis and mapping to visualize the values of key indicators on the dashboard. It will be the first dashboard of its kind for assessing and displaying census information in the country, enabling the GSS to improve coverage and enhance overall quality of census data.
What are some of the challenges you faced during the project, and how did you overcome them?
The main challenge was linked to data confidentiality issues and regulations. Ghanaian law stipulates that only persons directly working in the census data collection can access the census data. Initially, I was to develop both dynamic and static versions of the dashboard—the former meaning a dashboard that streams data (in near-real time) from the server where collected data was uploaded to, and the latter meaning a dashboard that retrieves data from a closed system (like a localized computer). As the census was still ongoing during the Fellowship, and the data being uploaded to the server was in a raw format (lacking an end-user API which can anonymize the data), I was not able to access actual census data for this project. This meant making a slight change to the project goals as I could only work with a static dashboard. It also meant that the dashboard could not as yet be used for its intended purposes.
However, I was given access to data collected during the census pilot period that covered five out of the16 provinces in Ghana. This data has been anonymized and is advantageous as it is always good to start with a small data set. It was agreed that from this trial data, I would focus on the housing indicators (types and conditions of the population's residential dwellings including the construction materials used, water, sanitation and hygiene access, asset ownership, etc.).
Another small challenge was that I was not familiar with the custom software and data frames required to access and interpret the trial data so this also caused a few delays as I had to research and familiarize myself with the software (CSPro). Using a python module (pyCSPro) designed specifically for CSPro data parsing, I was able to read the census data into suitable form. The library allows for parsing of CSPro cases and dictionaries.
Finally, organizing the training with the GSS census team was challenging, as they were in the thick of conducting the census itself, but we managed to work around this and scheduled most of the training for after the census was completed.
Can you give a brief description of the dashboard’s functionalities?
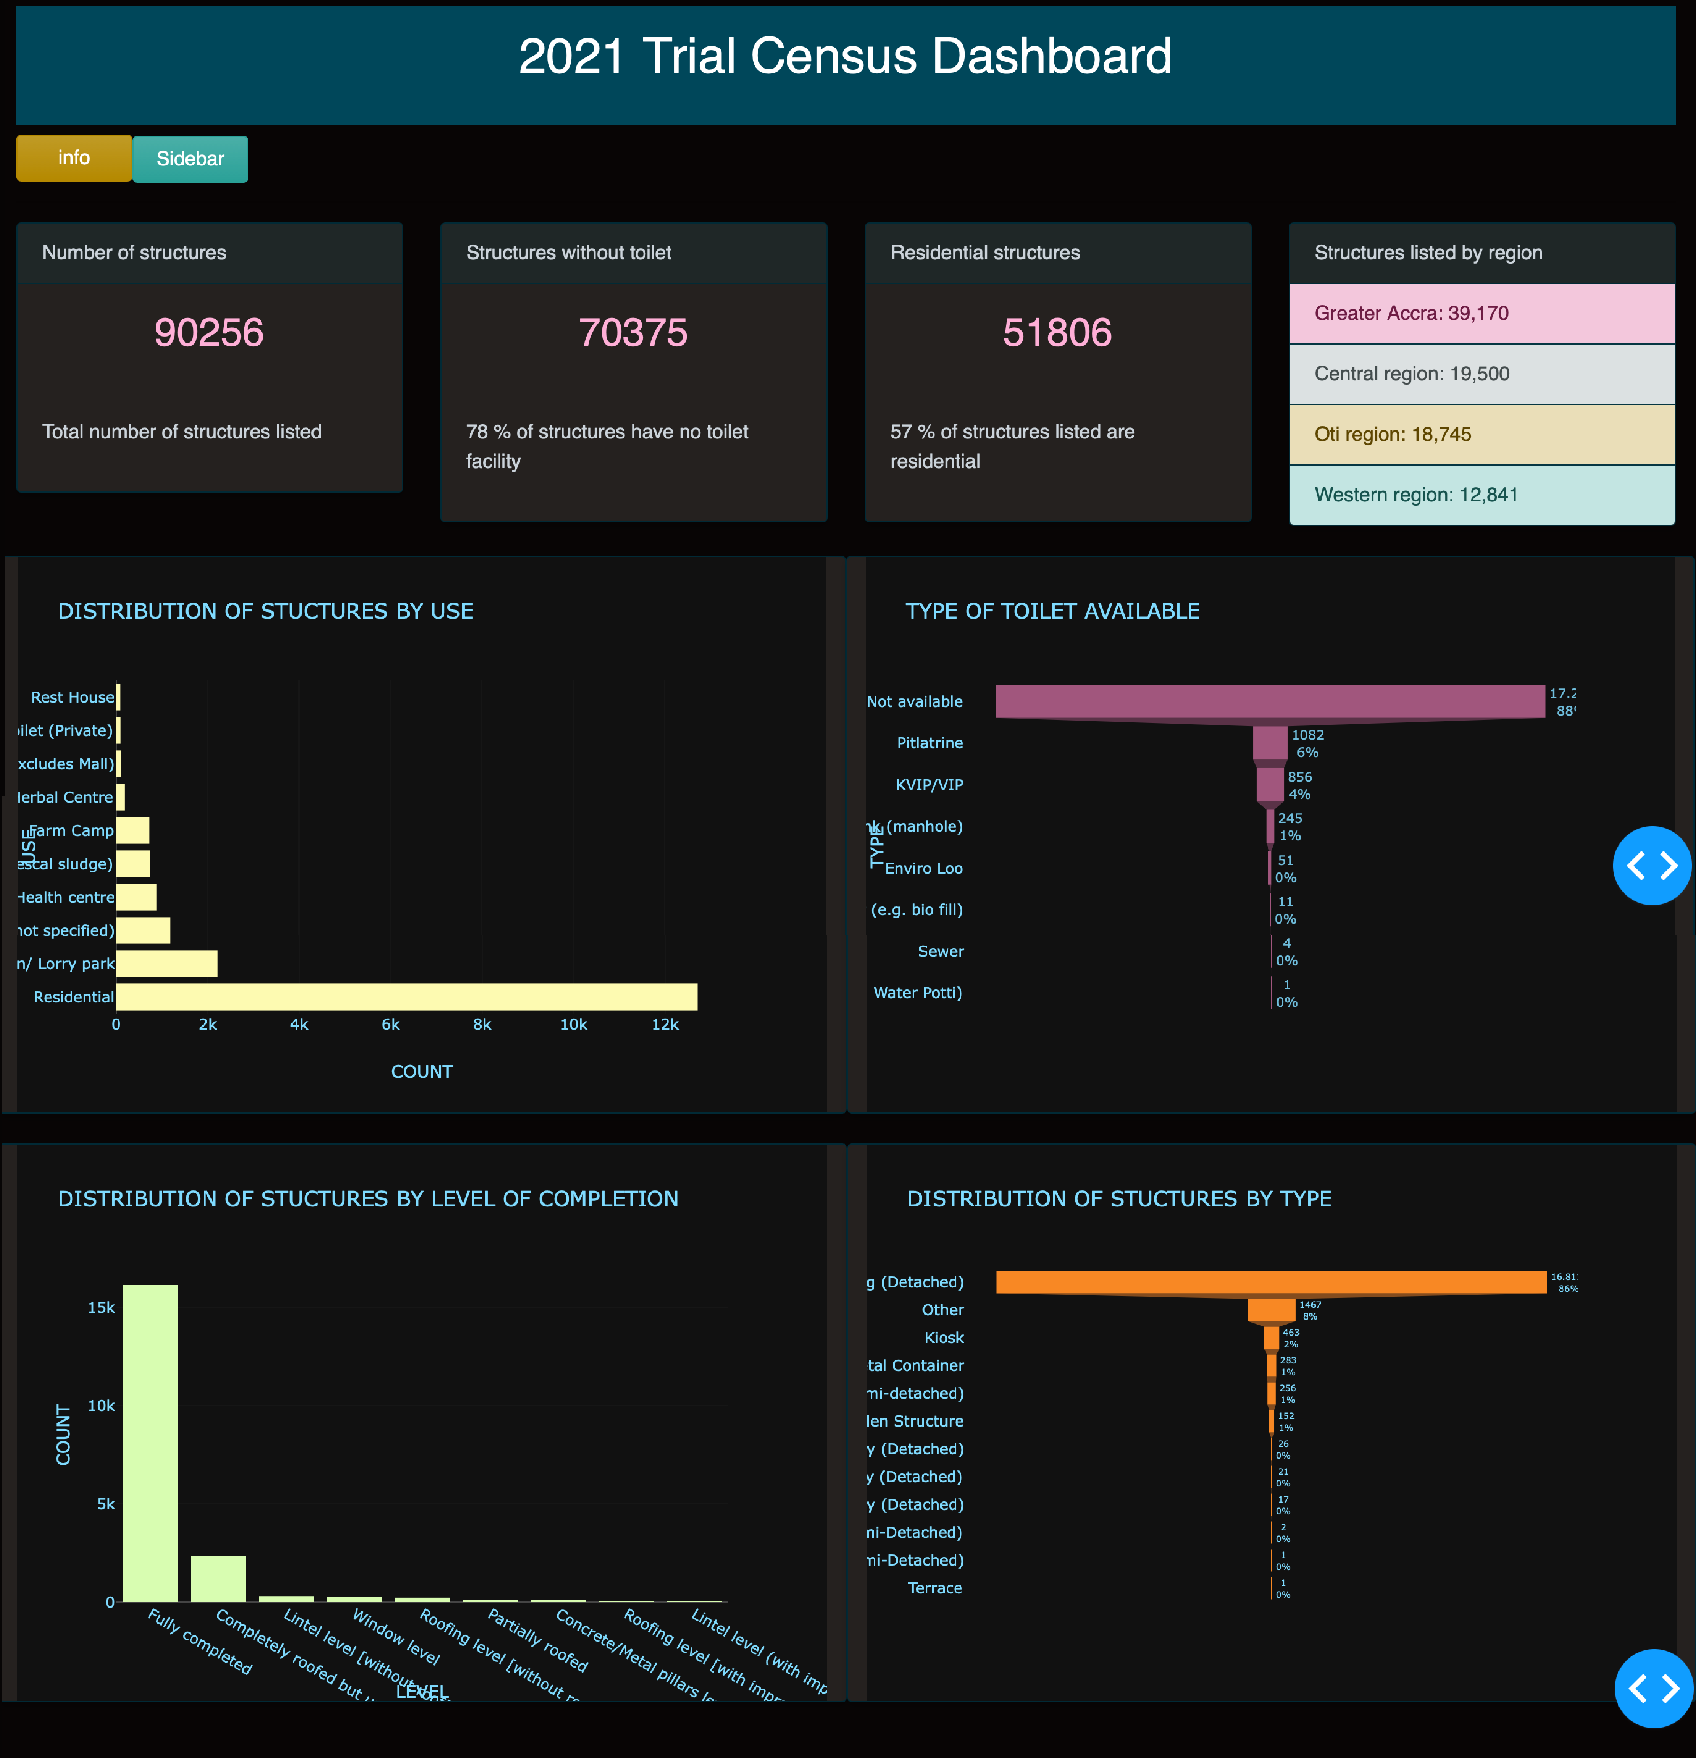
The dashboard was created using trial census data. This data was parsed with pyCSPro framework and read with pandas framework. The dashboard has two chained dropdown menus: one for the region and the other for the district (district selection is automatically linked with value selected at the region level). It has four summary cards representing the total structures listed, regional distribution of the structures, residential composition of the structures and structures without toilet facilities. The selection of the region and district produces four graphs on the level of completion, type of structures listed, use of the structures listed and the type of toilet available; these graphs change according to the user’s selection.
What did the training of GSS Data Science staff on development of the dashboard entail, and why?
The training was to ensure sustainability of the project by transferring practical knowledge to the team who will need to maintain and operate the dashboard after the Fellowship is concluded. Most of the team members had attended the data science training provided by AIMS right before the Fellowship began, so they have foundational knowledge in machine learning, data visualization, data pre-processing and Python for data science. Development is an entirely different phase beyond what they learned initially, and that was my focus during this training.
In collaboration with my supervisor, I built a training program on developing and deploying the dashboard. The training outline includes an introduction to the dash software, dash constituents, the requirements to develop and deploy a dashboard, etc. The idea was to develop and use an operational dashboard to demonstrate the end result of my work and then to train staff members on how to achieve that result and to further analyze and visualize the data, not just from the census but from other digital surveys the GSS will conduct in future. The GSS team will be able to complete some components of the dashboard as a practical component of their training.
When is the dashboard expected to be launched?
According to the Ghana Population and Housing Census Product Release Calendar, the census data will be published in different forms, including an interactive census results dashboard over the course of the next two years. The 2021 Population and Housing Census has already been published and contains results of the census, including information on population by administrative units and sex; household size by administrative unit; number and types of structures; and population density. The GSS data science team will be working on visualization of district-level administrative data over the next year, and as a result of the training, they will be equipped with the required skills such as data visualization, themes selection, etc., to design and deploy a fully functional dashboard using Python and Dash. The dashboard when complete will be publicly available so anyone can query and view the results of the just ended census with regional and district aggregations. Finally, the training component of the fellowship, when completed, will equip the GSS team needed to maintain and develop new dashboards for any subsequent surveys it will run in the future.