
As a part of the COVID-19: Data for a Resilient Africa initiative with the UN Economic Commission for Africa, the Global Partnership brokered collaboration between Omdena, one of our technical partners, and stakeholders Senegal to support use of AI in addressing data gaps on food security. The Global Partnership contributed to shaping the initiative’s objectives, while Omdena worked with technical teams in Senegal to provide support in developing data-driven tools.
This resource was originally published here by Omdena.
Problem statement
Senegal has had strong and stable economic growth in recent years. However, more than one-third of the population still lives below the poverty line, and 75 percent of families continue to struggle financially.
Agricultural success is essential to fight poverty and malnutrition, but with 70 percent of the crops in Senegal being rain-fed, the increase of droughts caused by climate change is a threat to essential crops and has a direct impact on the availability and prices of food.
AI can be used to predict crop yields all around the country in order to assure food security by guiding the farmers, planning food storage and transport, and by helping policymakers focus on the most vulnerable communities.Yield prediction in developing countries can help prevent famine, support the local economy, and improve sustainable agricultural practices.
Therefore, in this project, we studied a cheap approach using satellite imagery to predict crop yield. The main challenge we faced was the lack of ground truth data: surveys reporting the yields in Senegal.
Our approach
Identify literature about using Deep Learning (DL) to predict crop yield
The first step was to find research papers that could guide us to start this project efficiently considering the fact that we only had two months to implement a solution. The most interesting papers we found and used are: County-Level Soybean Yield Prediction Using Deep CNN-LSTM Model, Deep Gaussian Process for Crop Yield Prediction Based on Remote Sensing Data, and Deep Transfer Learning for Crop Yield Prediction with Remote Sensing Data.
Data
So the first question answered thanks to these papers was: What data do we need to train a Deep Learning model predicting crop yield?
Indeed, the authors used two types of raw data:
- Remote sensing data downloaded with Google Earth Engine (GEE)
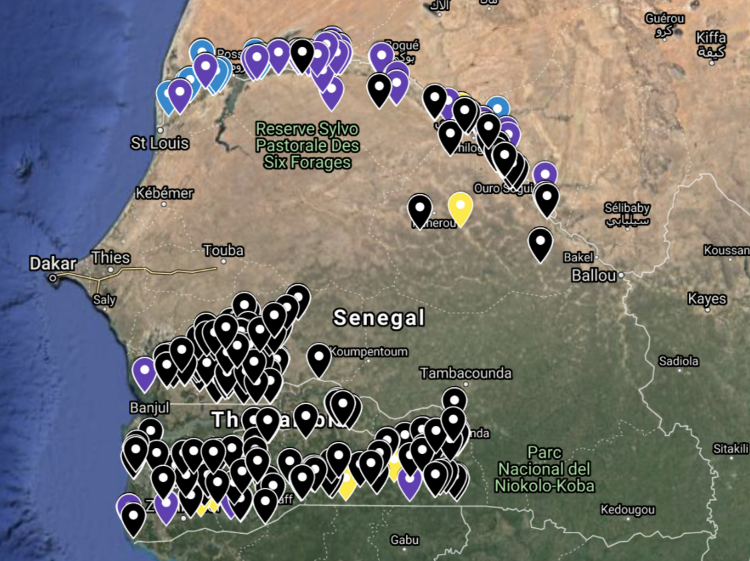
- Ground truth crop yield data: we had yield data collected by IPAR for the production of maize, rice, and millet in 2014
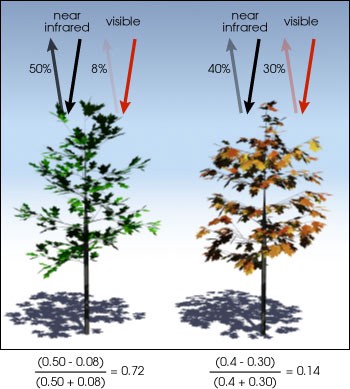
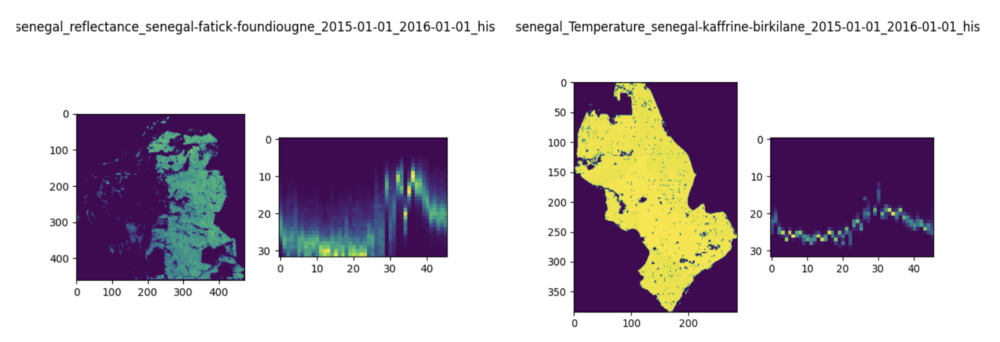
So, we downloaded the datasets MOD09A1.006 Terra Surface Reflectance 8-Day Global 500m and MYD11A2.006 Aqua Land Surface Temperature and Emissivity 8-Day Global 1km for the regions and departments of Senegal using Shapefiles. The first dataset has 7 bands of surface spectral reflectance that can be used to calculate the Normalized Difference Vegetation Index (NDVI), an indicator of vegetation’s health. The NDVI is calculated from the red light (which vegetation absorbs) and near-infrared light (which vegetation strongly reflects) reflected by vegetation.
The second dataset has two bands: temperature during the day and temperature during the night.
Which Crop Land Cover should we use? What is the Crop Land Cover used for?
The Crop Land Cover dataset is used as a crop cover mask. This means that all pixels of the reflectance and temperature images that are not classified as cropland pixels will be removed from the images so that the model will only be exposed to data from the crops, and not from cities for example.
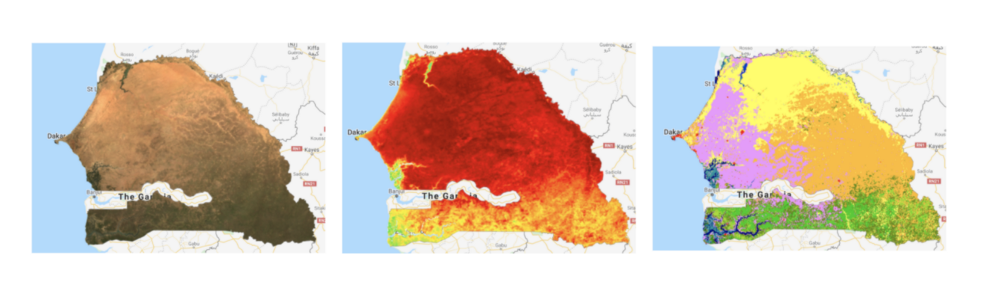
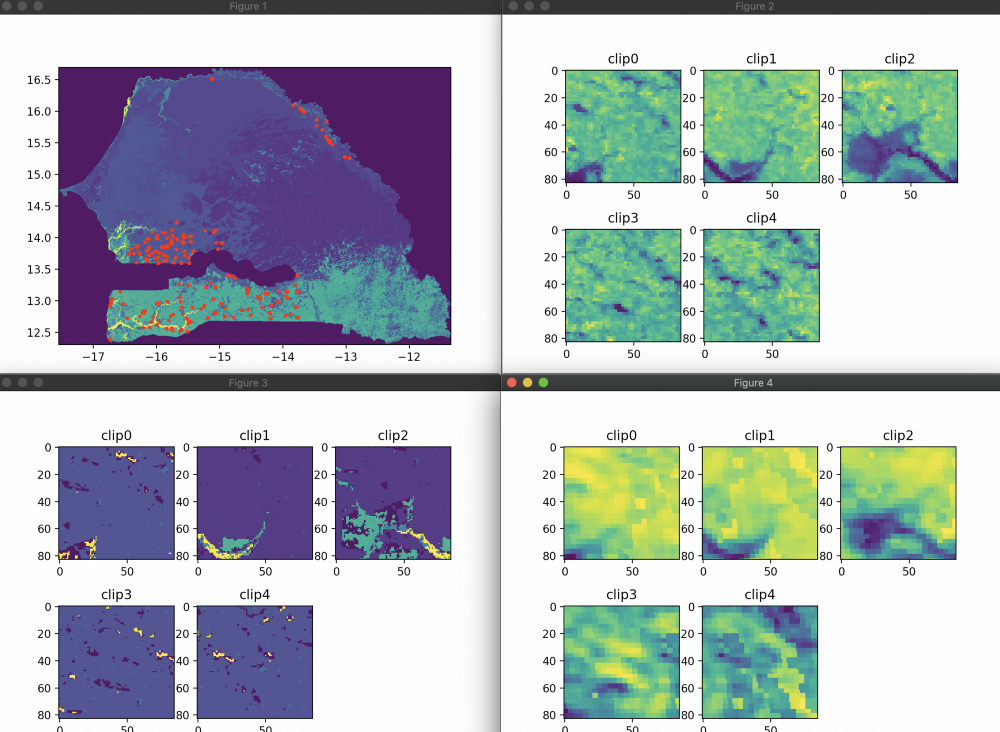
In the end, we used a different Land Cover dataset than the papers above. After comparing the MCD12Q1.006 MODIS Land Cover Type Yearly Global 500m that these papers used with the Copernicus Global Land Cover Layers, we decided to use the latter. This decision was taken after comparing the datasets with cropland maps of Senegal:
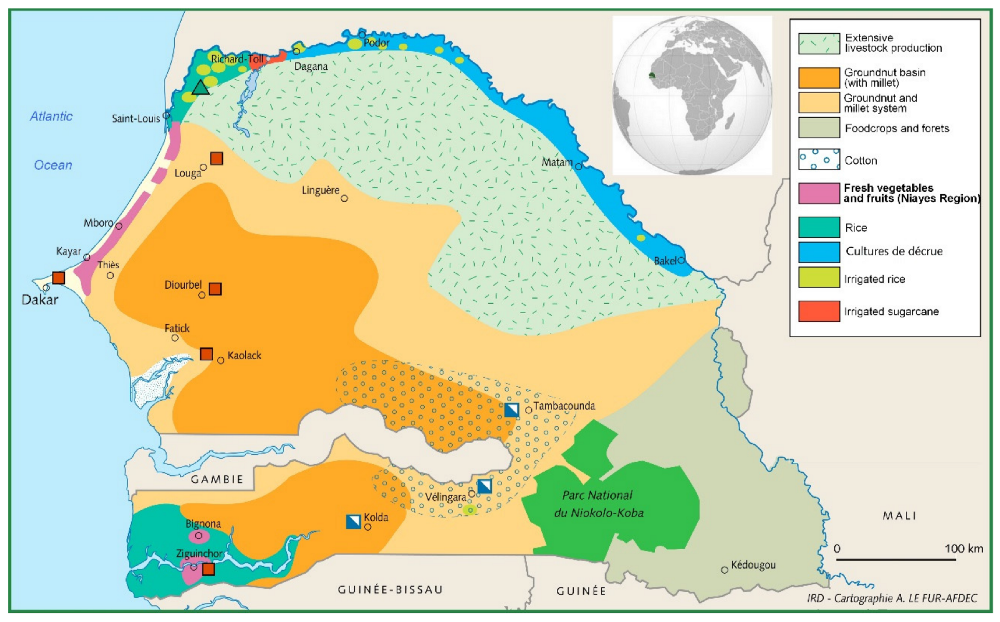
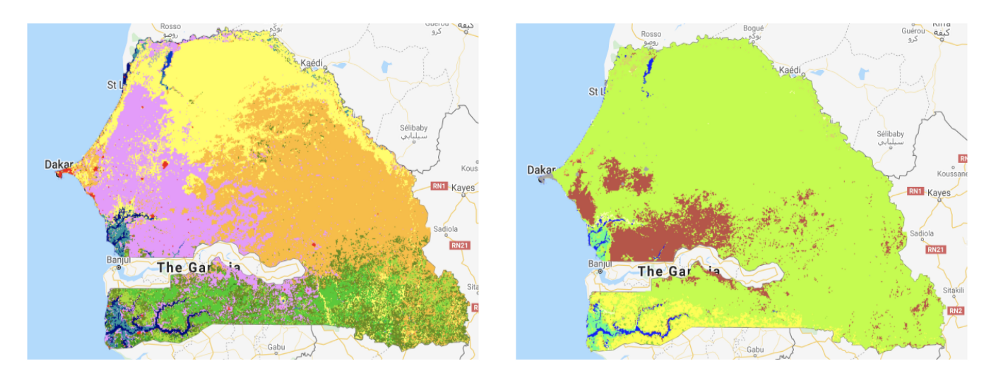
Here, we see that the crops are mostly located in the South-West and the Northern regions of Senegal. However, when we look at the MCD12Q1.006 MODIS dataset where the cropland is labeled as brown, we see that a lot of the cropland is actually missing (Northern crops and most of the rice crops next to the Casamance River) but this is not the case with the Copernicus dataset, where the cropland is in labeled as pink. So we came to the conclusion that the Copernicus dataset was the most accurate for Senegal.
The only problem with the Copernicus dataset is the time range: 2015–2020, knowing that we had ground truth yield data for the year 2014. However, we assumed that the land cover for the year 2014 was close enough to the one from 2015 and still better than the 2014 MCD12Q1.006 MODIS dataset, so used the 2015 Copernicus land cover as a crop mask for images from 2014.
At the end of this step, we had collected data for the three GEE datasets presented above, for the entire country, the regions, departments, and GPS locations from the IPAR study.
Preprocessing of the Data
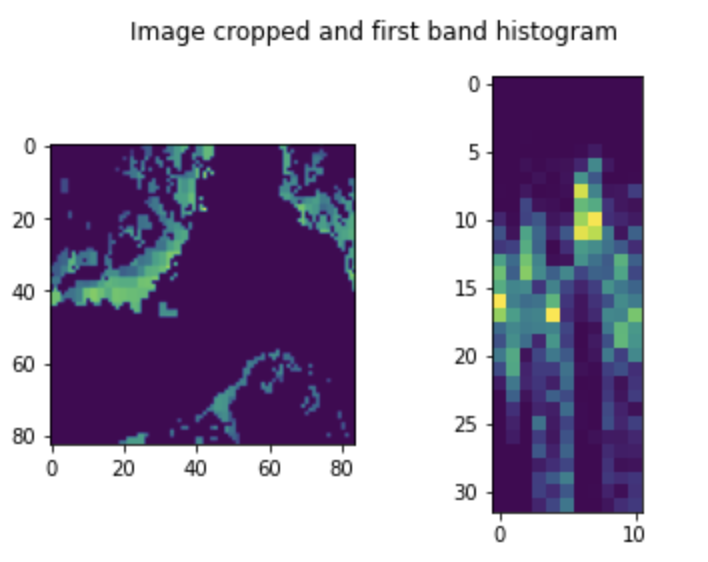
According to the papers cited previously, using 3-D pixels count histograms instead of raw satellite images for the prediction of yield helps to avoid the model from overfitting (model too closely fit to a limited set of data points).
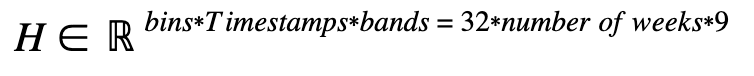
What is the number of weeks mentioned above?
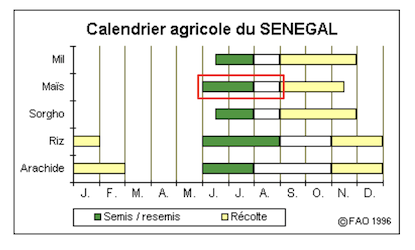
In order to focus on the growing season, we only studied the images of the weeks following the planting of the seeds to the harvesting, which is, for instance, week 19–30 for maize.
Deep Learning Model
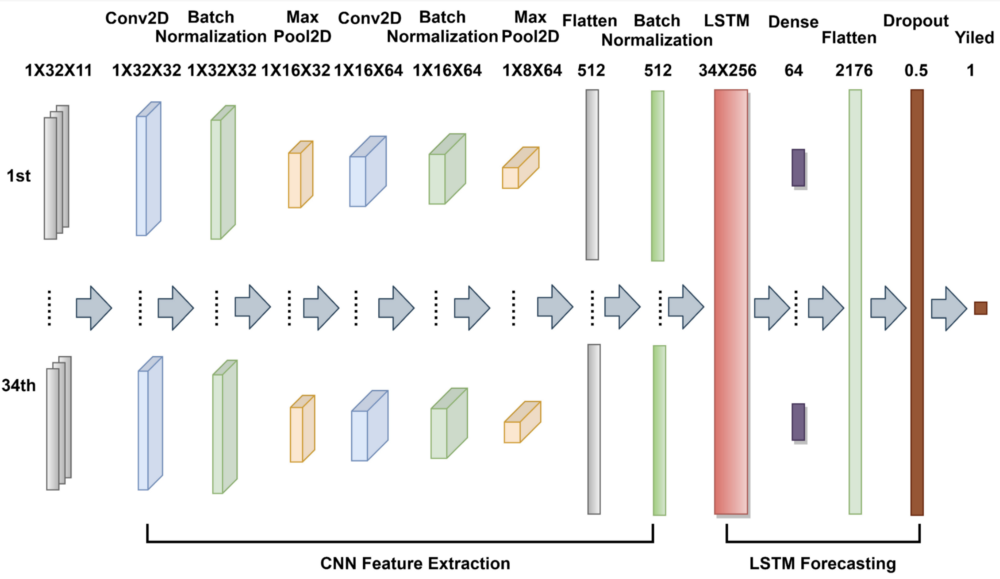
We decided to use the Deep Learning architecture from this paper which is a CNN-LSTM:
“CNN can learn the relevant features from an image at different levels similar to a human brain. An LSTM has the capability of bridging long time lags between inputs over arbitrary time intervals. The use of LSTM improves the efficiency of depicting temporal patterns at various frequencies, which is a desirable feature in the analysis of crop growing cycles with different lengths.”
We also tried to use the CNN architecture proposed in this paper but the results were not satisfying, the model was finding a random value for all data points that minimized the loss, and then did not learn or improve afterward even with different hyperparameters. Since we were having better results with the CNN-LSTM, we decided to only focus on the latter.
Transfer Learning
We used transfer learning to improve the maize model. We had some yield data from South Sudan and Ethiopia (Source: deep-transfer-learning-crop-prediction) that we used to train the model and then fine-tuned it using the yield data from Senegal.
Data augmentation
We tried to do some data augmentation on the IPAR dataset by taking sliding windows around the point of origin (lat/lon) and assuming the yield of the crops in these sliding windows was the same as at the point.
This method did not improve the maize and millet results but did improve the rice model.
Results
We ran several trainings with the different approaches explained previously and collected the resulting metrics:
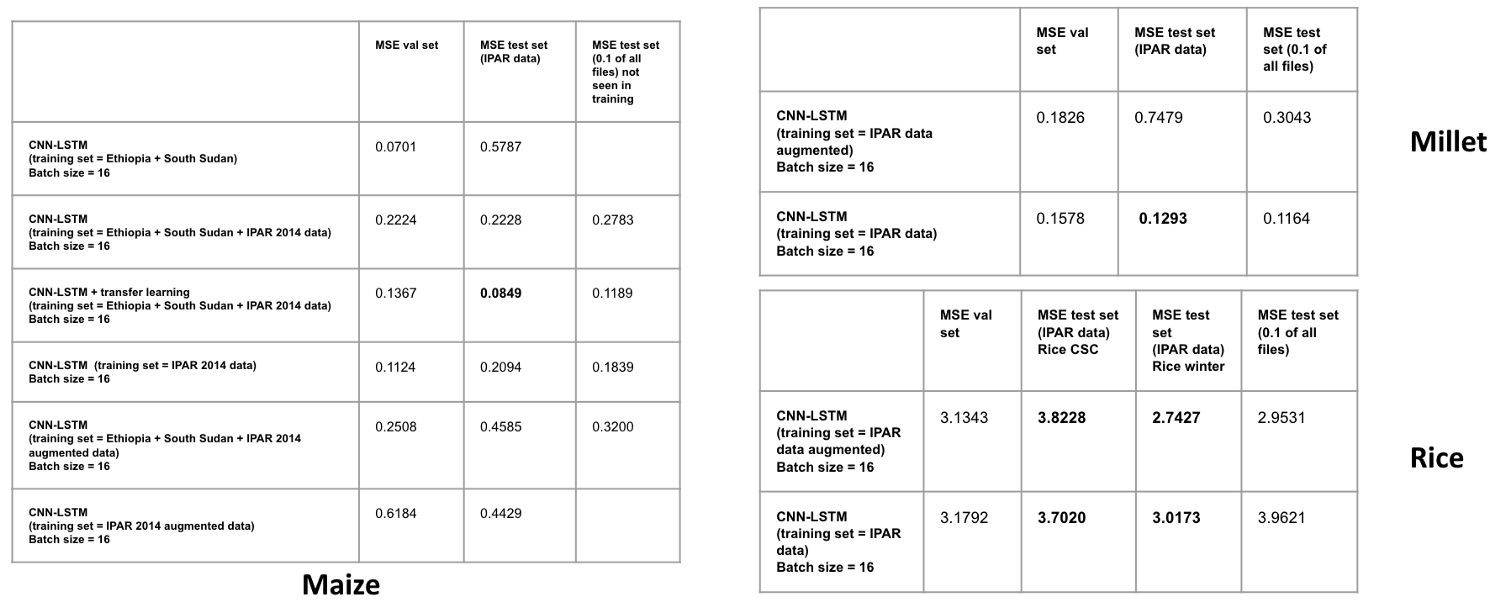
We can see that the Transfer Learning for the maize model did improve the MSE (Mean square error) and therefore was our best MSE. In comparison, the millet model did not do as well as the maize model but we did not have any other data to perform transfer learning. Finally, the rice model could be improved using data from other countries from the same Github repository where you found the maize data. To be noted: the MSE is higher for the rice model because the yields of rice are higher than the maize and millet yields in the first place (up to 14 T/ha).
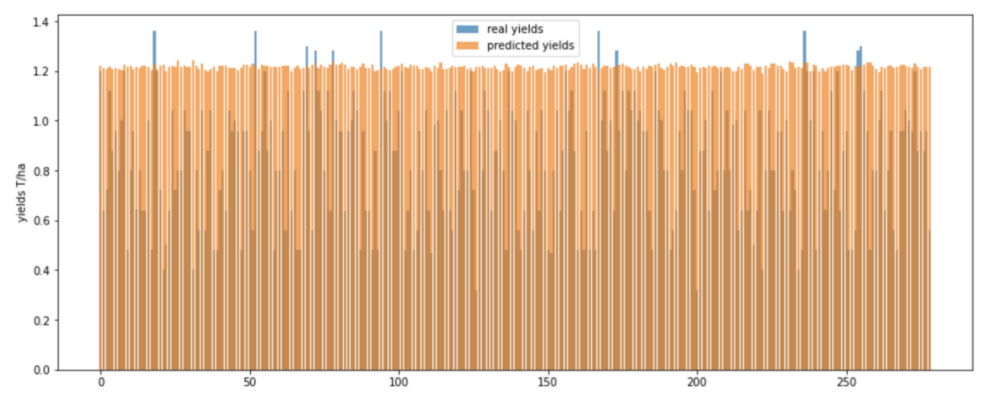
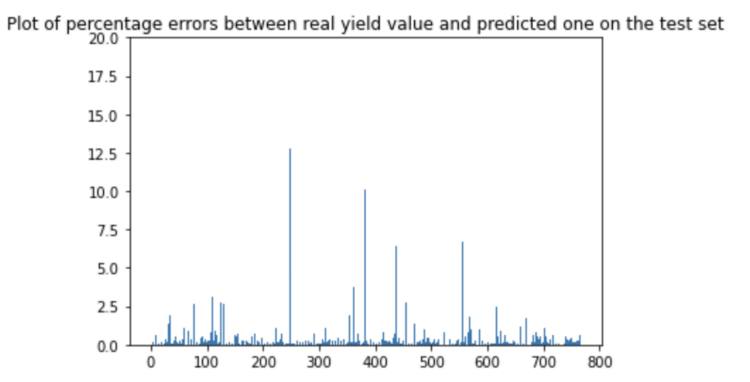
Here are some visualizations of the maize results:
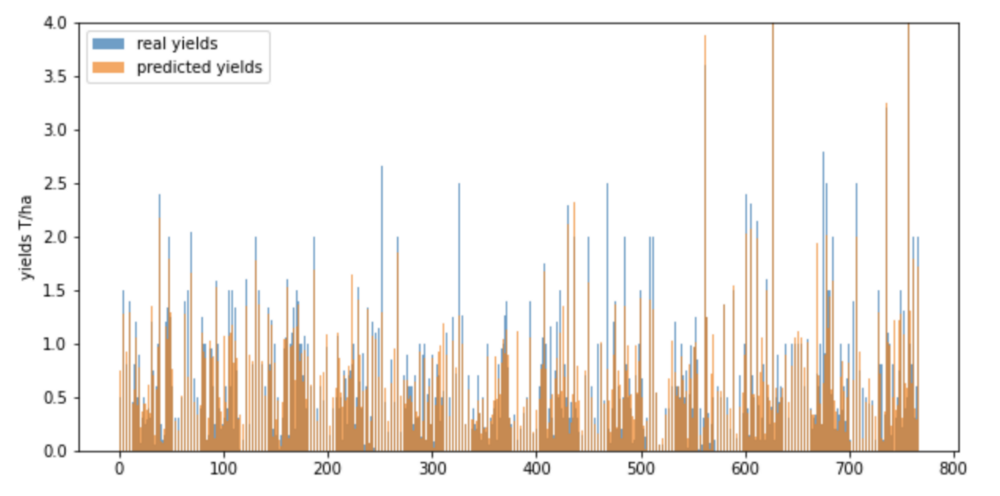
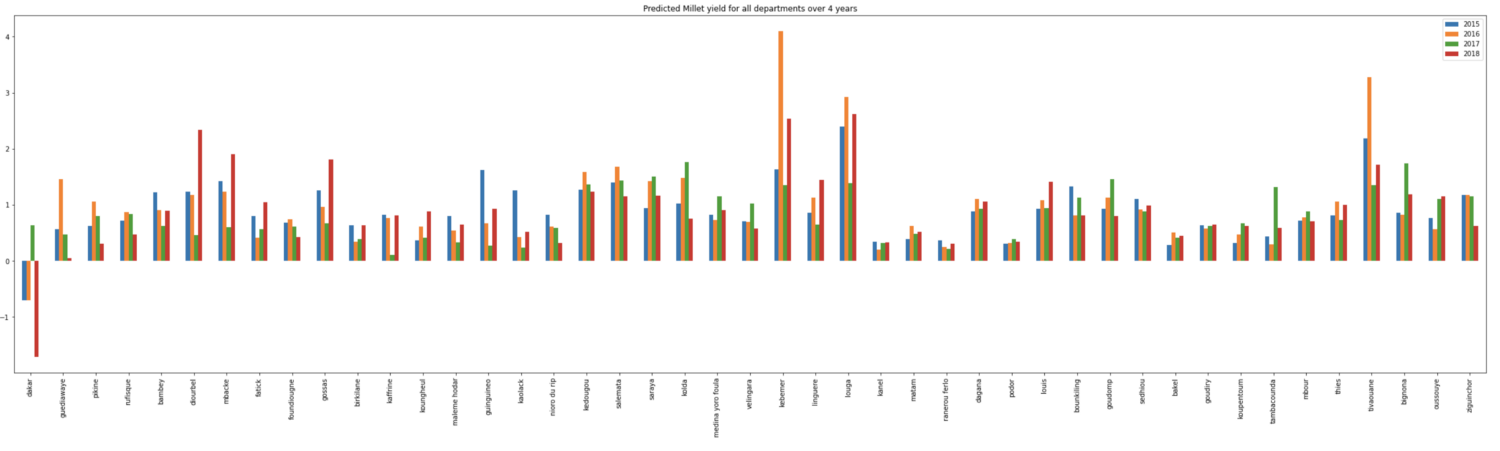
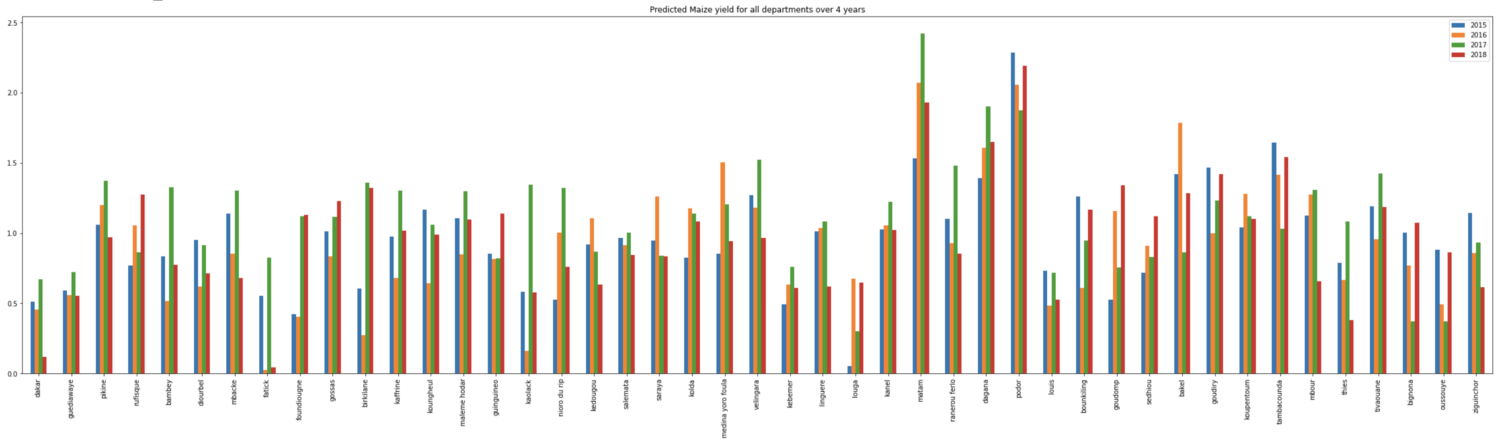
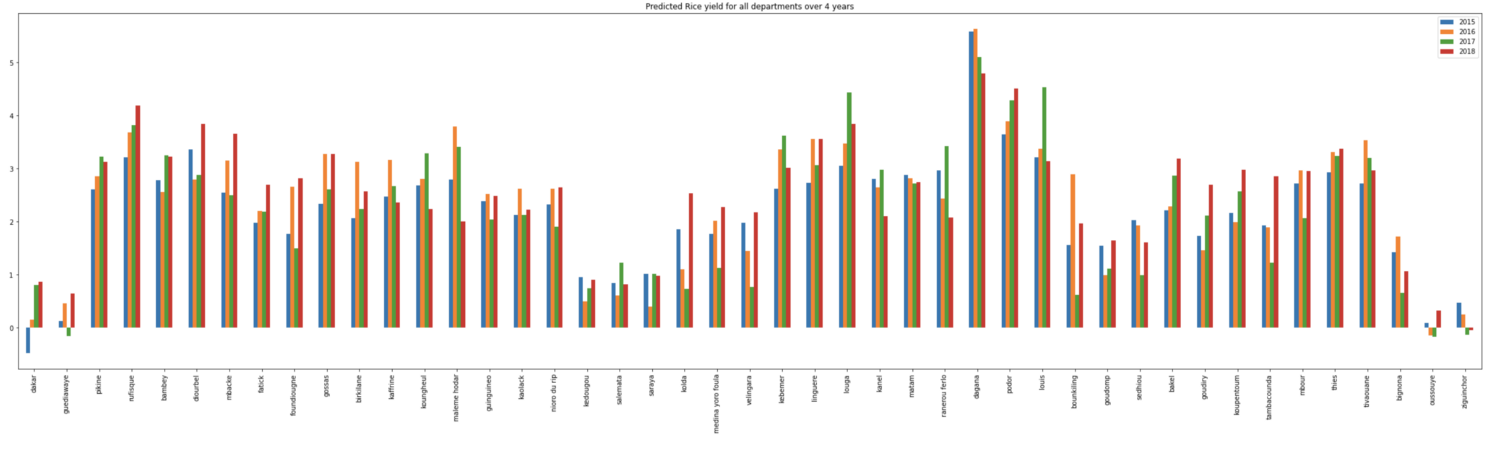
We also ran the predictions on every department of Senegal over 4 years (2015–2018) for maize, rice and millet:
Final product
We created an interactive notebook where the user can select the region they want to predict the yield. The user can also choose the year and crop type. While this notebook has several application areas. For instance, it can be used as a tool for policymakers to decide what food to import and export in order to maintain food security in the country. The tool can also help farmers make management and financial decisions.
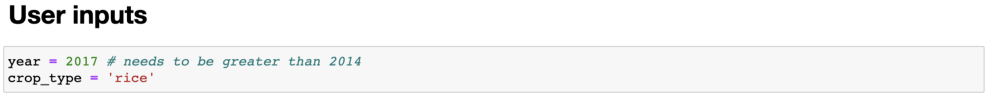
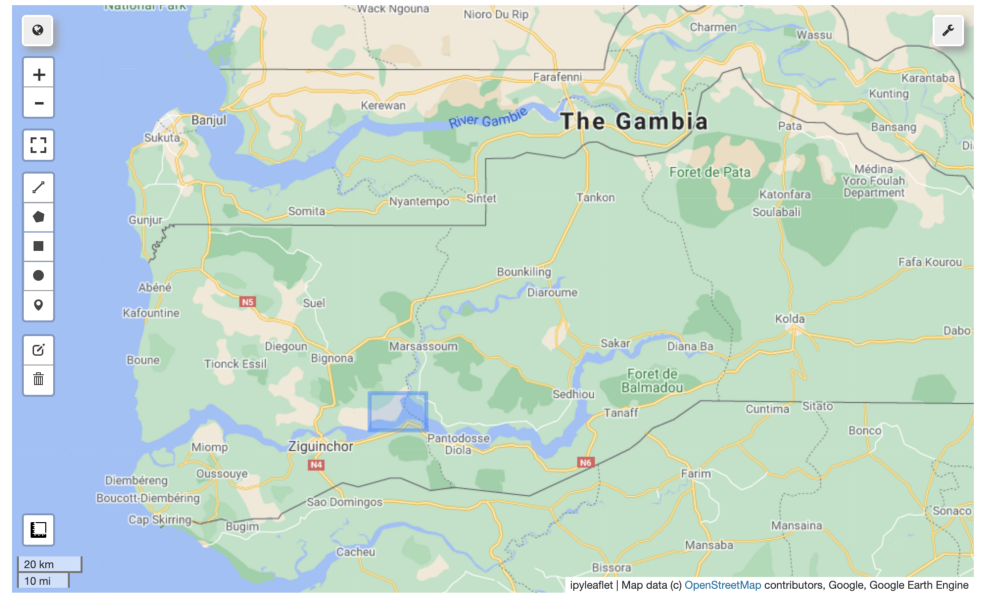

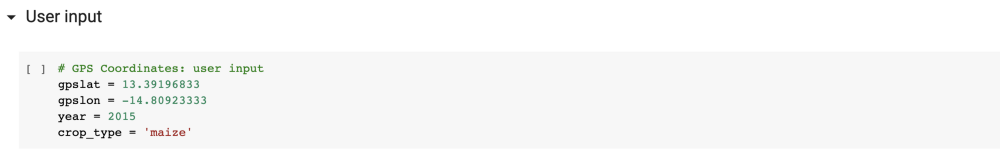
We also implemented another notebook that will take as input the GPS latitude and longitude instead of a selected area:

Conclusion
To conclude, in these two months, we were able to implement a Deep Learning model that predicts crop yield in Senegal following this schema:
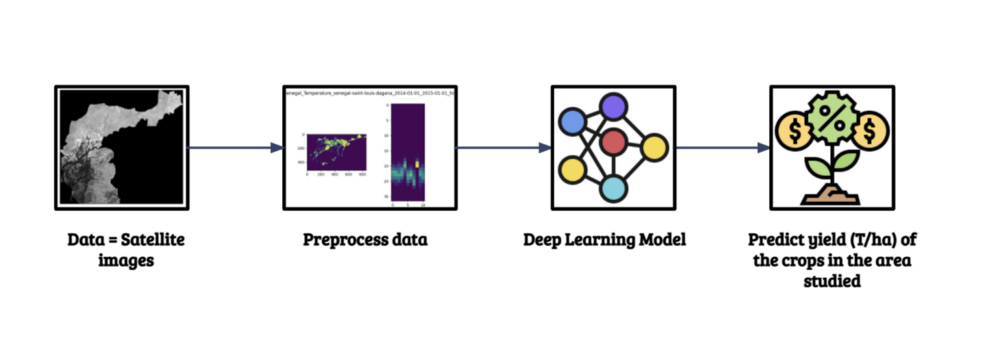
As mentioned in this article, the lack of ground truth data was an issue that made the models not as efficient and accurate for Senegal as they could be. An improvement easily implementable would be to have ground-truth data like the 2014 IPAR dataset but for several years in order to be able to show the model the fluctuations over the years so that it could learn it and be more flexible to variations in the data.
